
Release Date :
Reference Number :
SR-2025-009
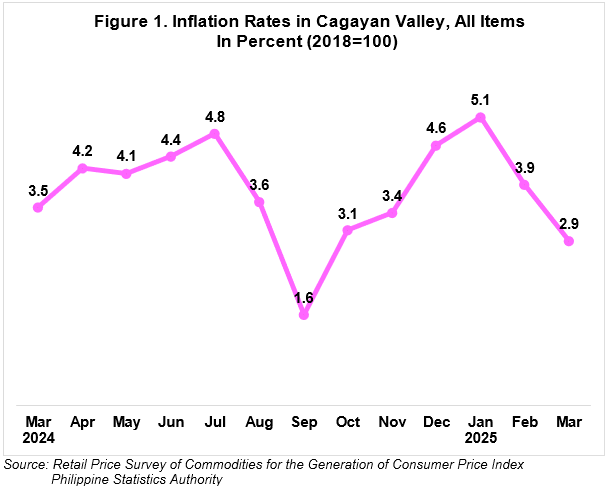
The overall inflation of Cagayan Valley slowed down to 2.9 percent in
March 2025 from 3.9 percent in February 2025. This brings the region’s average inflation to 3.9 percent from January to March 2025. In comparison, the inflation rate in March 2024 was higher, at 3.5 percent. (Figure 1)
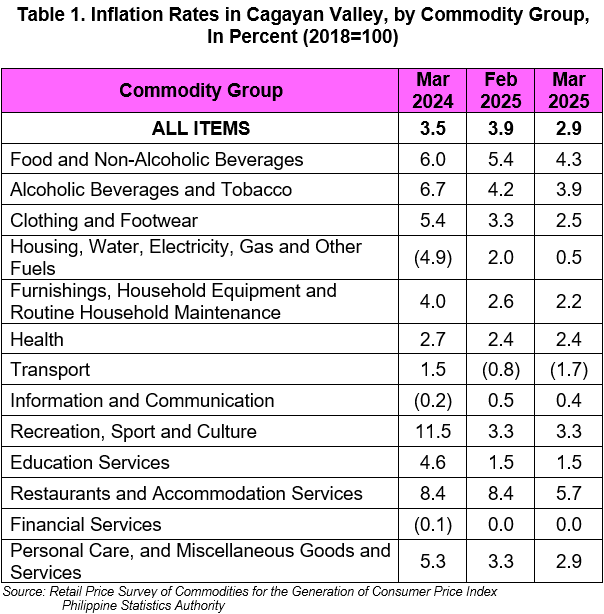
The decline in the headline inflation of Cagayan Valley in March 2025 was primarily brought about by the slower annual increment of food and non-alcoholic beverages, which recorded 4.3 percent during the month from 5.4 percent in February 2025. The downward trend in housing, water, electricity, gas and other fuels at 0.5 percent from 2.0 percent, and restaurants and accommodation services at 5.7 percent from 8.4 percent, also contributed to the decrement.
Moreover, lower annual increments were also noted in the indices of the following commodity group for the month of February 2025:
Transport, -1.7 percent from -0.8 percent;
Clothing and footwear, 2.5 percent from 3.3 percent;
Personal care, and miscellaneous goods and services, 2.9 percent from 3.3 percent;
Furnishings, household equipment and routine household maintenance, 2.2 percent from 2.6 percent;
Alcoholic beverages and tobacco, 3.9 percent from 4.2 percent; and
Information and Communication, 0.4 percent from 0.5 percent.
The indices of the rest of the commodity groups retained their respective previous month's inflation rates. (Table 1)
The indices of the rest of the commodity groups retained their respectiv
The top three commodity groups contributing to the March 2025 overall inflation of Cagayan Valley were the following:
a. Food and non-alcoholic beverages, with 67.2 percent share or contributing 2.0 percentage points to the overall regional inflation;
b. Restaurants and accommodation services, with 16.3 percent share or contributing 0.5 percentage point to the overall regional inflation; and
c. Alcoholic beverages and tobacco, with 4.7 percent share or contributing 0.1 percentage points to the overall regional inflation.
Table 1. Inflation Rates in Cagayan Valley, by Commodity Group,
In Percent (2018=100)
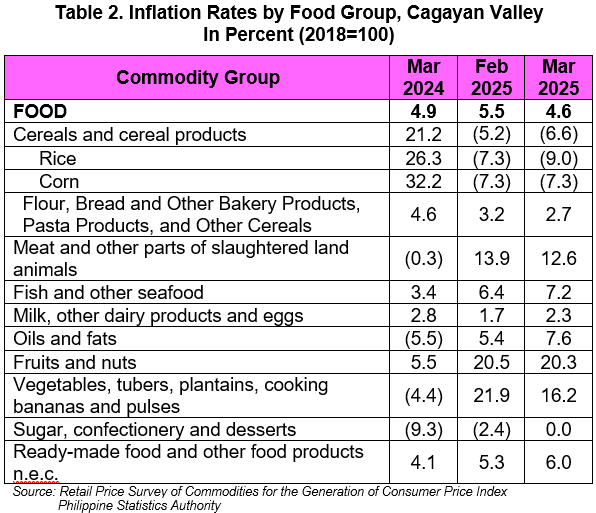
Food inflation in Cagayan Valley decreased to 4.6 percent in March 2025 from 5.5 percent in February 2025. In March 2024, food inflation was higher at 6.3 percent.
The deceleration of food inflation in March 2025 was mainly influenced by the lower inflation rate of vegetables, tubers, plantains, cooking bananas and pulses at 16.2 percent during the month in review from 21.9 percent in February 2025. This was followed by the faster year-on-year decline of rice at -9.0 percent in March 2025 from -7.3 percent in February 2025 and meat and other parts of slaughtered land animals, with an inflation rate of 12.6 percent from 13.9 percent.
In addition, the inflation rate of the following food items showed a decline in their respective inflation rates during the month in review:
Fruits and nuts, 20.3 percent from 20.5 percent; and
Fruits and nuts, 20.3 percent from 20.5 percent; andFruits and nuts, 20.3 percent from 20.5 percent; and
Flour, bread and other bakery products, pasta products, and other cereals, 2.7 percent from 3.2 percent.
On the contrary, higher inflation rates in March 2025 compared to February 2025 were observed in the indices of the following food groups:
Fish and other seafood, 7.2 percent from 6.4 percent;
Milk, other dairy products and eggs, 2.3 percent from 1.7 percent;
Oils and fats, 7.6 percent from 5.4 percent;
Sugar, confectionery and desserts, 0.0 percent from -2.4 percent; and
Ready-made food and other food products n.e.c., 6.0 percent from 5.3 percent.
Food inflation shared 65.1 percent or 2.0 percentage points to the overall inflation in March 2025. The top three food groups in terms of contribution to the food inflation during the month were the following:
a. Meat and other parts of slaughtered land animals, with a share of 63.7 percent;
b. Vegetables, tubers, plantains, cooking bananas and pulses, with a share of 31.5 percent; and
c. Fish and other seafood, with a share of 23.6 percent.
All provinces experienced deceleration in their inflation rates during the month in review. The Province of Cagayan recorded the highest inflation among five provinces with 4.5 percent inflation from 4.9 percent in February 2025. Meanwhile, Quirino posted the lowest inflation rate, with 1.6 percent inflation in March 2025 from 2.0 percent in the previous month. (Table 3)
All provinces experienced deceleration in their inflation rates during the month in review. The Province of Cagayan recorded the highest inflation among five provinces with 4.5 percent inflation from 4.9 percent in February 2025. Meanwhile, Quirino posted the lowest inflation rate, with 1.6 percent inflation in March 2025 from 2.0 percent in the previous month. (Table 3)
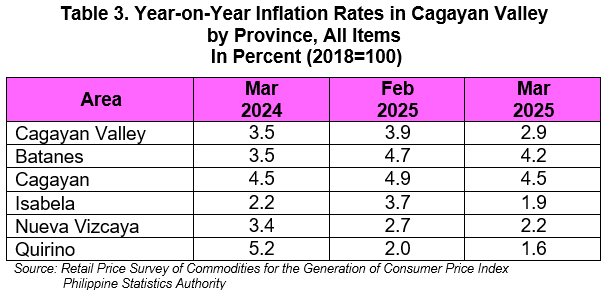
The Province of Isabela posted the highest percent share to the lower inflation rate of the region with 75.6 percent. The lower inflation rate of the province was observed in the indices of the following commodity groups:
Food and non-alcoholic beverages, 4.4 percent from 6.3 percent;
Housing, water, electricity, gas and other fuels, -5.0 percent from -1.8 percent;
Restaurants and accommodation services, 4.0 percent from 8.4 percent;
Transport, -1.2 percent from -0.7 percent;
Furnishings, household equipment and routine household maintenance, 0.9 percent from 1.0 percent; and
Recreation, sport and culture, 4.7 percent from 4.8 percent.
The rest of the commodity groups in the province either remained at their previous month’s rates or had higher inflation rates.
In terms of the region’s inflation rate for the bottom 30% income households, it eased to 2.5 percent in March 2025 from 3.7 percent in February 2025. In March 2024, the inflation rate was posted at 3.6 percent. (Figure 2)
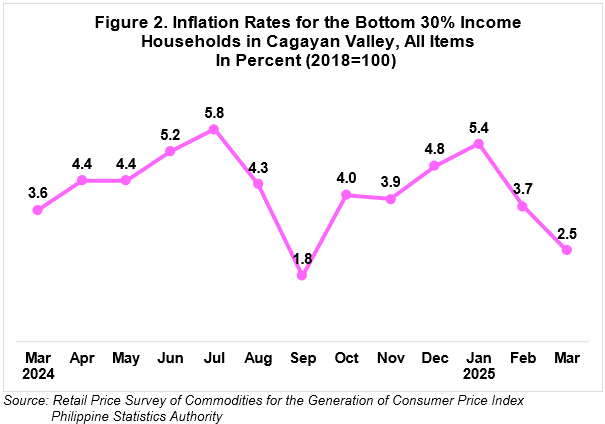
The main driver of the downtrend of the overall inflation for this income group in March 2025 was the lower year-on-year growth rate of the food and non-alcoholic beverages at 3.4 percent during the month from 4.3 percent in February 2025. The inflation of housing, water, electricity, gas and other fuels at -2.7 percent in March 2025 from 0.6 percent in February 2025, and restaurants and accommodation services at 6.5 percent from 9.4 percent, also contributed to the decrease in inflation.
In addition, lower inflation rates were posted by the following commodity groups:
In addition, lower inflation rates were posted by the following commodity groups:In addition, lower inflation rates were posted by the following commodity groups:Transport, -1.2 percent from -0.6 percent;
Personal care, and miscellaneous goods and services, 3.1 percent from 3.5 percent;
Clothing and footwear, 1.9 percent from 2.6 percent;
Alcoholic beverages and tobacco, 4.2 percent from 4.5 percent;
Furnishings, household equipment and routine household maintenance, 1.7 percent from 1.9 percent; and
Information and Communication, 0.5 percent from 0.6 percent.
The indices of the rest of the commodity groups retained their respective previous month’s inflation rates.
_________________________________________________________________________
Note: CPIs and inflation rates by province and selected city are posted at the PSA OpenSTAT Portal at (https://openstat.psa.gov.ph/).
ENGR. GIRME M. BAYUCAN
(Chief Statistical Specialist)
Officer-in-Charge, PSA-RSSO II
//EMDP/SJCP
| Attachment | Size |
|---|---|
|
|
1.25 MB |