
Release Date :
Reference Number :
SR-2025-015
1. Number of Constructions
Residential buildings shared more than half of the total number of building constructions. The number of constructions from approved building permits in February 2025 reached 513. This indicates an annual decline of 6.0 percent from the 546 total number of constructions in the same month of the previous year. Meanwhile, the number of constructions in January 2025 was lower at 428 constructions.
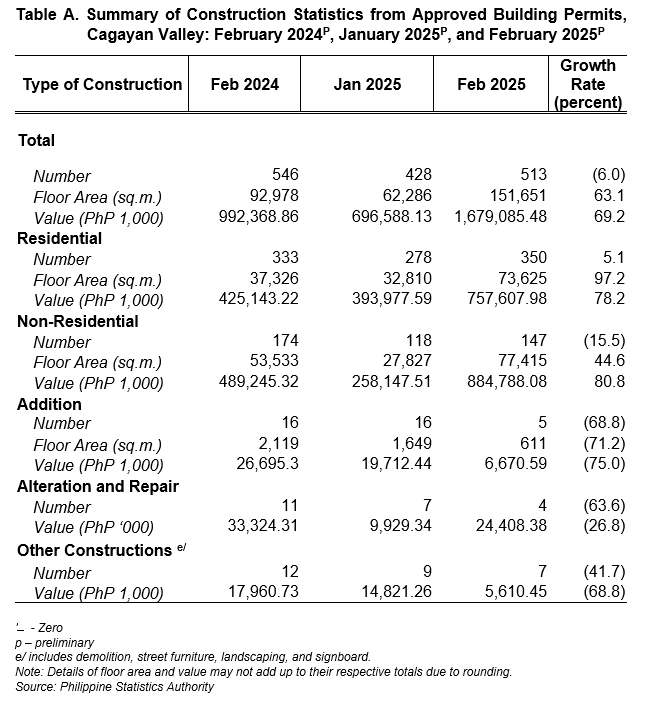
Cagayan Province still recorded the highest number of building constructions in February 2025, with 307 constructions, which accounted 59.8 percent share to the total number of constructions in the region. Meanwhile, Batanes had the least number with only 2 building constructions, or 0.4 percent share. (Figure 1)
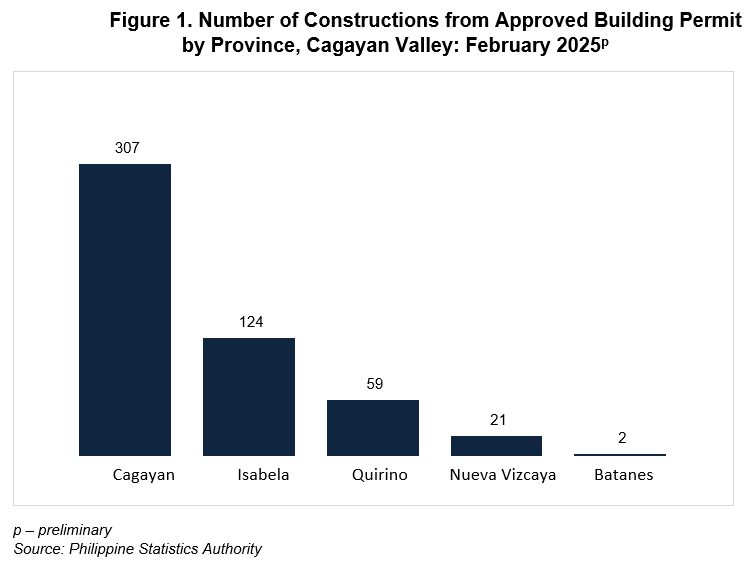
By type of construction, residential buildings reported the highest number of constructions at 350 or 68.2 percent of the total number of constructions during the month. This recorded an increase of 5.1 percent from the same month of previous year’s level of 333 constructions. Majority of the total residential constructions were single type of houses with 330 constructions (94.3%). (Figure 2a, and Table A)
Meanwhile, non-residential type of construction was the second highest in terms of number of constructions at 147 or 28.7 percent of the total number of constructions during the month. This type of construction showed a downtrend with a decline of 15.5 percent. Most of the non-residential constructions were commercial buildings with 114 constructions (77.6 %). (Figure 2b, and Table A)
Addition, which refers to any new construction that increases the height or area of an existing building, alteration and repair of existing structures, and other constructions contributed 1.0 percent, 0.8 percent and 1.4 percent to the total number of constructions, respectively. Compared with their respective number of constructions in the same period of the previous year, the annual rate for addition and alteration and repair dropped by 68.8 percent and 63.6 percent, respectively. While other constructions increased by 41.7 percent during the period.
2. Value of Constructions
Non-residential buildings shared more than 50 percent of the total value of constructions. In February 2025, the total value of constructions amounted to PhP 1.68 billion, reflecting an increment of 69.2 percent from the PhP 992.37 million value of constructions posted in the same month of the previous year. The value of constructions in January 2025 was lower at PhP 696.59 million.
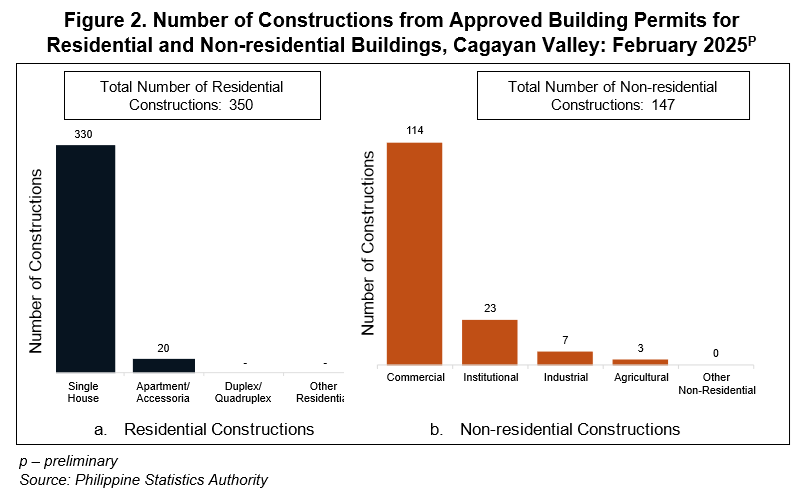
Non-residential buildings amounted to PhP 884.79 million or 52.7 percent of total construction value in February 2025. This reflects an increment of 80.8 percent from the PhP 489.25 million value of constructions of non-residential buildings reported in the same month of the previous year. Among non-residential buildings, institutional-type buildings recorded the highest value of construction at PhP 495.69 million or 56.0 percent of the total value of non-residential building constructions. (Figure 3b, and Table A)
Meanwhile, the construction value of residential building constructions valued at PhP 757.61 million accounted for 45.1 percent of the total value of constructions during the period. This indicates an increase of 78.2 percent from the PhP 425.14 million construction value of residential buildings recorded in the same month of 2024. Among residential constructions, single-type buildings had the highest value of constructions at PhP 451.97 million or 59.66 percent of the total value of residential building constructions. (Figure 3a, and Table A).
3. Floor Area
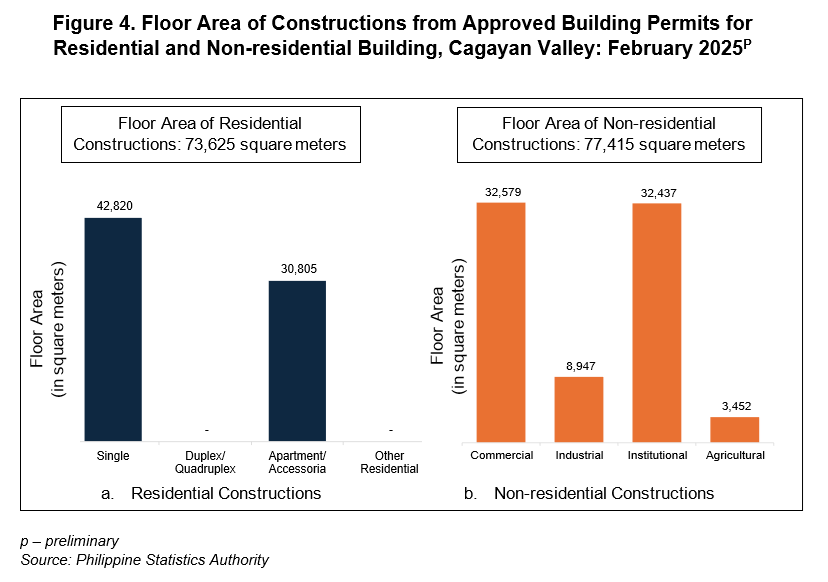
Total floor area posted more than 60 percent growth rate. The total floor area of constructions in February 2025 was recorded at 151,651 square meters. This excludes alteration and repair, other non-residential constructions such façade, helipad, niche, water tank, etc., and other constructions which include demolition, street furniture, landscaping, and signboards, since there is no floor area for these types of constructions. The total floor area in February 2025 registered an increment of 63.1 percent from the recorded 92,978 square meters floor area in the same period of the previous year.
Non-residential constructions recorded 77,415 square meters or 51.0 percent of the total floor area of constructions during the month. This reflects a decrement of 44.6 percent from the recorded floor area of non-residential constructions at 53,533 square meters in the same month of 2024. (Figure 4b, and Table A). Meanwhile, residential constructions recorded 73,725 square meters or 48.5 percent of the total floor area of constructions in February 2025. It increased at an annual rate of 97.2 percent from the previous year’s same month floor area of 37,326 square meters. (Figure 4a, and Table A)
4. Average Cost of Construction
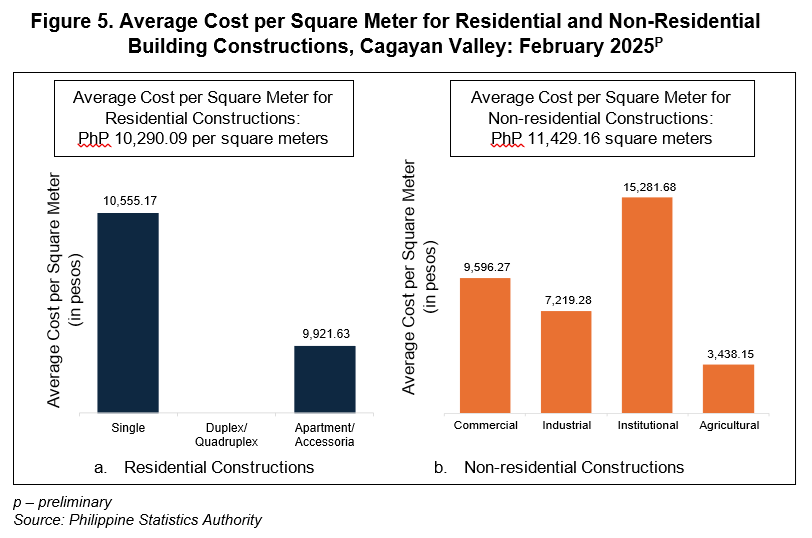
Non-residential buildings had the highest average cost of constructions. The average cost of constructions in February 2025 was recorded at PhP 11,072.04 per square meter. This was 3.7 percent lower than the average cost of PhP 10,673.16 per square meter in February 2024. Alteration and repair, and other non-residential, were excluded in the average cost of construction since there is no reported floor area for these types of construction.
By type of construction, non-residential construction had the highest average cost of PhP 11,429.16 per square meter. This was followed by addition to existing constructions with PhP 10,917.50 per square meter and residential constructions with PhP 10,290.09 per square meter.
Among non-residential constructions, Institutional buildings recorded the highest average cost of construction at PhP 15,821.68 per square meter. On the other hand, under residential, single-type houses had the highest average cost of construction at PhP 10,555.17 per square meter.
Engr. GIRME M. BAYUCAN
(Chief Statistical Specialist)
Officer-in-Charge, PSA-RSSO II
//EMDP/MLLP/SJCP
| Attachment | Size |
|---|---|
|
|
1.38 MB |
Reference Period
2025