
Release Date :
Reference Number :
SR-2025-021
1. Number of Constructions
Residential buildings shared more than half of the total number of building constructions
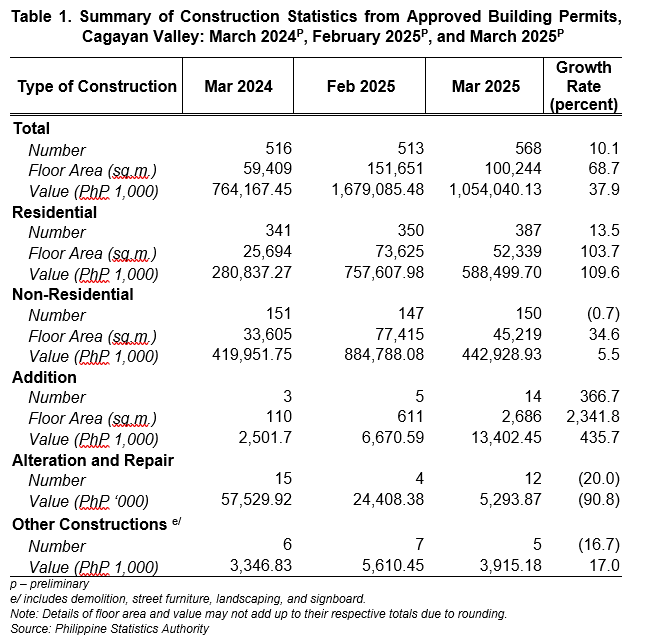
The number of constructions from approved building permits in March 2025 reached 568. This indicates an increase of 10.1 percent from the 516 total number of constructions in the same month of the previous year. Meanwhile, the number of constructions in February 2025 was also lower at 513 constructions.
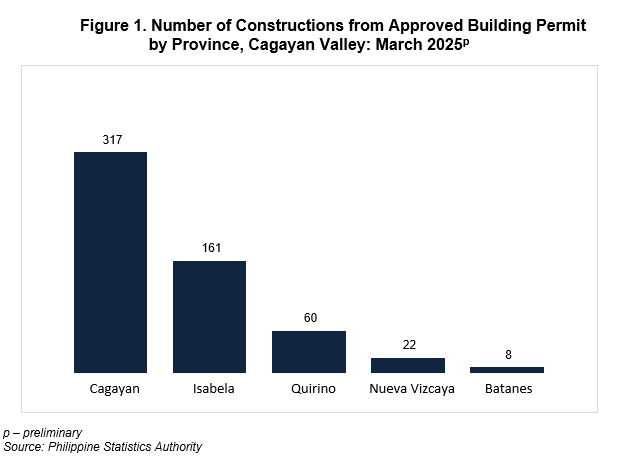
Cagayan Province still recorded the highest number of building constructions in March 2025, with 317 constructions, which accounted 55.8 percent share to the total number of constructions in the region. Meanwhile, Batanes had the least number with only 8 building constructions, or 1.4 percent share. (Figure 1)
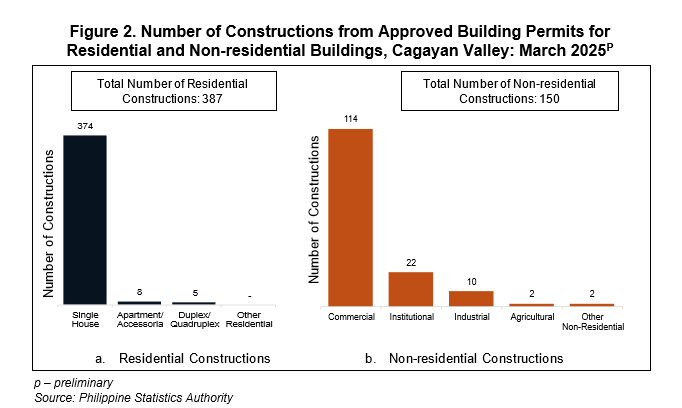
By type of construction, residential buildings reported the highest number of constructions at 387 or 68.1 percent of the total number of constructions during the month. This recorded an increase of 13.5 percent from the same month of previous year’s level of 341 constructions. Majority of the total residential constructions were single type of houses with 374 constructions (96.6%). (Figure 2, and Table 1)
Meanwhile, non-residential type of construction was the second highest in terms of number of constructions at 150 or 26.4 percent of the total number of constructions during the month. This type of construction showed a downtrend with a decline of 0.7 percent. Most of the non-residential constructions were commercial buildings with 114 constructions (76.0 %). (Figure 2, and Table 1)
Addition, which refers to any new construction that increases the height or area of an existing building, alteration and repair of existing structures, and other constructions contributed 2.5 percent, 2.1 percent and 0.9 percent to the total number of constructions, respectively. Compared with their respective number of constructions in the same period of the previous year, the annual rate for addition increased by 366.7 percent. While alteration and repair and other constructions dropped by 20.0 percent and 16.7 percent, respectively, during the period.
2. Value of Constructions
Residential buildings recorded the highest value of constructions
In March 2025, the total value of constructions amounted to PhP 1.05 billion, reflecting an increment of 37.9 percent from the PhP 764.17 million value of constructions posted in the same month of the previous year. The value of constructions in February 2025 was higher at PhP 1.68 billion.
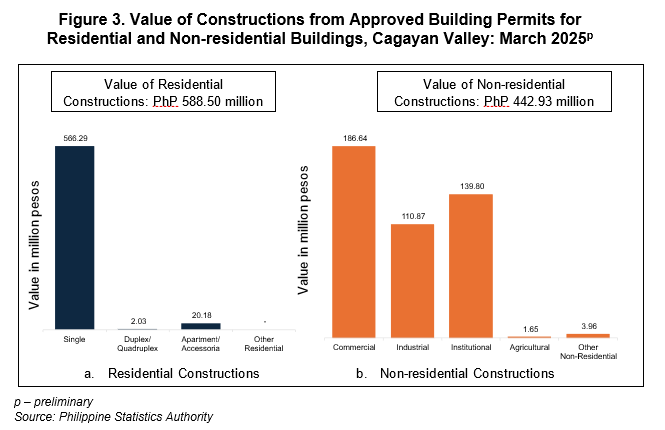
Residential building constructions valued at PhP 588.50 million accounted for 55.8 percent of the total value of constructions during the period. This indicates an increase of 109.6 percent from the PhP 280.84 million construction value of residential buildings recorded in the same month of 2024. Among residential constructions, single-type buildings had the highest value of constructions at PhP 566.29 million or 92.23 percent of the total value of residential building constructions. (Figure 3, and
Table 1)
Meanwhile, the construction value of non-residential buildings amounted to PhP 442.93 million or 42.0 percent of total construction value in March 2025. This reflects an increment of 5.5 percent from the PhP 419.95 million value of constructions of non-residential buildings reported in the same month of the previous year. Among non-residential buildings, commercial-type buildings recorded the highest value of construction at PhP 186.64 million or 42.1 percent of the total value of non-residential building constructions. (Figure 3, and Table 1)
3. Floor Area
Residential buildings accounted for more than half of the total floor area of constructions
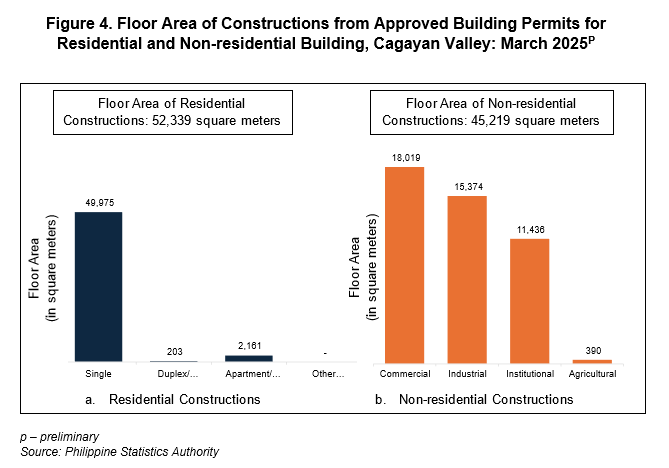
The total floor area of constructions in March 2025 was recorded at 100,244 square meters. This excludes alteration and repair, other non-residential constructions such façade, helipad, niche, water tank, etc., and other constructions which include demolition, street furniture, landscaping, and signboards, since there is no floor area for these types of constructions. The total floor area in March 2025 registered an increment of 68.7 percent from the recorded 59,409 square meters floor area in the same period of the previous year.
Residential constructions recorded 52,339 square meters or 52.2 percent of the total floor area of constructions in March 2025. It increased at an annual rate of 103.7 percent from the previous year’s same month floor area of 25,694 square meters. (Figure 4, and Table 1)
Meanwhile, non-residential constructions recorded 45,219 square meters or 45.1 percent of the total floor area of constructions during the month. This reflects a decrement of 34.6 percent from the recorded floor area of non-residential constructions at 33,605 square meters in the same month of 2024. (Figure 4, and Table 1)
4. Average Cost of Construction
Residential buildings had the highest average cost of constructions
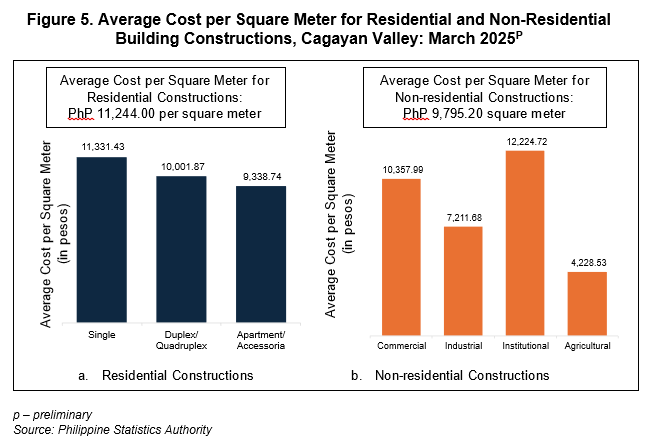
The average cost of constructions in March 2025 was recorded at PhP 10,422.88 per square meter. This was 52.1 percent lower than the average cost of PhP 21,943.94 per square meter in March 2024. Alteration and repair, and other non-residential, were excluded in the average cost of construction since there is no reported floor area for these types of construction.
By type of construction, residential construction had the highest average cost of PhP 11,244.00 per square meter. This was followed by non-residential constructions with PhP 9,795.20 per square meter and addition with PhP 4,989.74 per square meter.
Among non-residential constructions, Institutional buildings recorded the highest average cost of construction at PhP 12,224.72 per square meter. On the other hand, under residential, single-type houses had the highest average cost of construction at PhP 11,331.43 per square meter. (Figure 5)
Engr. GIRME M. BAYUCAN
(Chief Statistical Specialist)
Officer-in-Charge, PSA-RSSO II
//EMDP/SJCP
| Attachment | Size |
|---|---|
|
|
1.92 MB |