Release Date :
Reference Number :
SR-2025-023
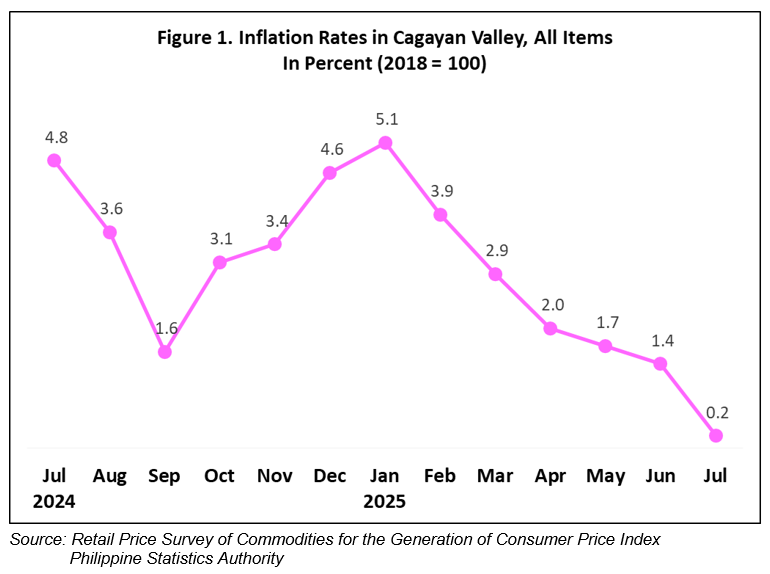
The headline inflation or overall inflation of Cagayan Valley slowed down further to 0.2 percent in July 2025 from 1.4 percent in June 2025. This is the lowest inflation rate since the zero percent recorded in November 2019. This brings the average inflation rate from January to July 2025 to 2.4 percent. In July 2024, the inflation rate was higher at 4.8 percent. (Figure 1)
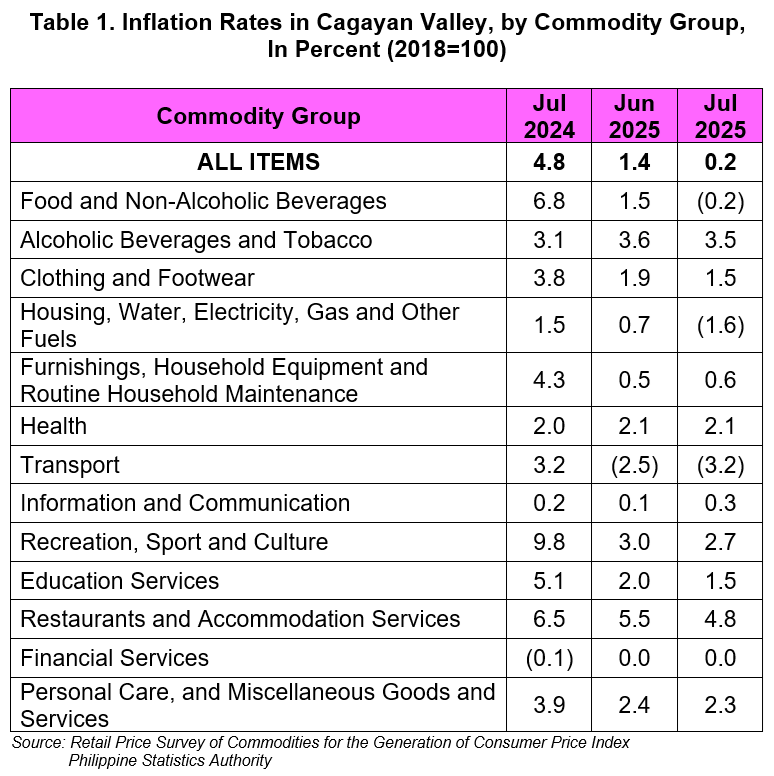
The downtrend in the overall inflation of Cagayan Valley in July 2025 was primarily brought about by the slower annual increment in the index of food and non-alcoholic beverages at -0.2 percent in July 2025 from 1.5 percent in the previous month. Also contributing to the downtrend was the lower inflation rate of housing, water, electricity, gas and other fuels at -1.6 percent during the month from 0.7 percent in June 2025.
Lower annual increments were also noted in the indices of the following commodity groups during the month:
• Transport, -3.2 percent from -2.5 percent;
• Restaurants and accommodation services, 4.8 percent from 5.5 percent;
• Clothing and footwear, 1.5 percent from 1.9 percent;
• Education services, 1.5 percent from 2.0 percent;
• Personal care, and miscellaneous goods and services, 2.3 percent from 2.4 percent;
• Recreation, sport and culture, 2.7 percent from 3.0 percent; and
• Alcoholic beverages and tobacco, 3.5 percent from 3.6 percent.
In contrast, the following commodity groups registered higher inflation rate during the month in review:
• Furnishings, household equipment and routine household maintenance, 0.6 percent from 0.5 percent; and
• Information and communication, 0.3 percent from 0.1 percent.
The indices of the rest of the commodity groups retained their respective previous month’s inflation rates. (Table 1)
The top three commodity groups contributing to the July 2025 overall inflation of Cagayan Valley were the following:
a. Restaurants and accommodation services, with 331.2 percent share or contributing 0.7 percentage point to the overall regional inflation;
b. Alcoholic beverages and tobacco, with 100.0 percent share or contributing 0.2 percentage point to the overall regional inflation; and
c. Personal care, and miscellaneous goods and services, with 89.8 percent share or contributing 0.2 percentage point to the overall regional inflation.
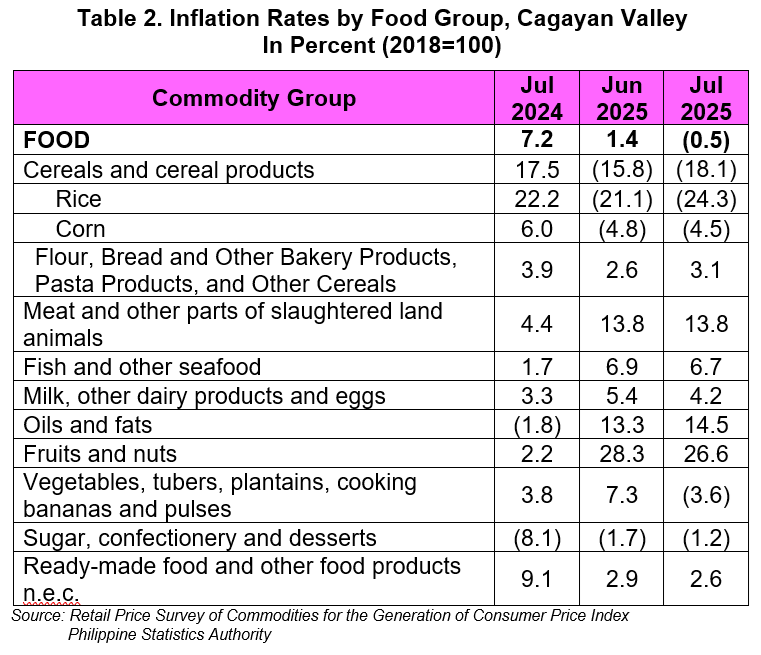
Food inflation in the region decreased to -0.5 percent in July 2025 from 1.4 percent in June 2025. In July 2024, food inflation was higher at 7.2 percent. (Table 2)
The deceleration of food inflation in July 2025 was mainly influenced by the faster year-on-year decline in the index of vegetables, tubers, plantains, cooking bananas and pulses at -3.6 percent during the month from 7.3 percent annual decrease in June 2025.
Moreover, lower inflation rates during the month were noted in the following food groups:
• Rice, -24.3 percent from -21.1 percent;
• Milk, other dairy products and eggs, 4.2 percent from 5.2 percent;
• Fruits and nuts, 26.6 percent from 28.3 percent;
• Fish and other seafood, 6.7 percent from 6.9 percent; and
• Ready-made food and other food products n.e.c., 2.6 percent from 2.9 percent.
On the other hand, higher annual growth rates were observed in the indices of the following food groups during the month:
• Corn, -4.5 percent from -4.8 percent;
• Flour, bread and other bakery products, pasta products, and other cereals, 3.1 percent from 2.6 percent;
• Oils and fats, 14.5 percent from 13.3 percent; and
• Sugar, confectionery and desserts, -1.2 percent from -1.7 percent.
The top three food groups in terms of contribution to the food inflation during the month were the following:
a. Cereals and cereal products, with -5.85 percentage points share;
b. Vegetables, tubers, plantains, cooking bananas and pulses, with -0.38 percentage points share; and
c. Sugar, confectionery and desserts, with -0.04 percentage points share.
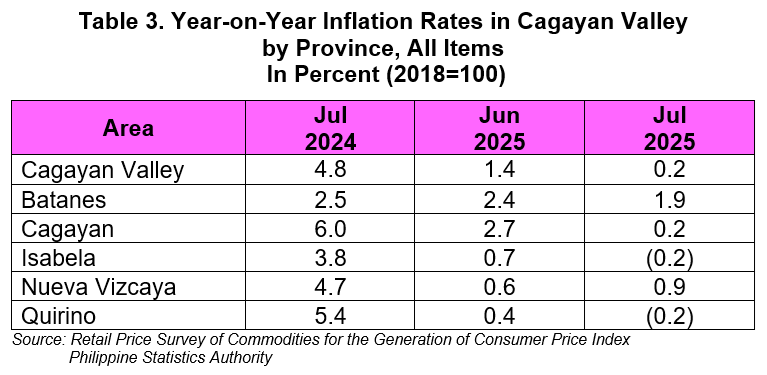
Relative to their respective June 2025 inflation rates, four provinces exhibited lower inflation rates in July 2025, except for Nueva Vizcaya which showed otherwise. Batanes posted the highest inflation rate of 1.9 percent, while Isabela and Quirino both registered the lowest inflation rate of -0.2 percent. (Table 3)
Cagayan province posted the highest percent share to the lower inflation rate of the region with 67.8 percent. The lower inflation rate of the province was observed in the indices of the following commodity groups:
• Food and non-alcoholic beverages, -1.7 percent from 2.3 percent;
• Housing, water, electricity, gas and other fuels, 2.1 percent from 4.8 percent;
• Restaurants and accommodation services, 6.7 percent from 9.0 percent;
• Transport, -3.5 percent from -2.4 percent;
• Personal care, and miscellaneous goods and services, 2.6 percent from 3.2 percent;
• Clothing and footwear, 1.0 percent from 1.8 percent;
• Education services, 0.5 percent from 1.7 percent;
• Alcoholic beverages and tobacco, 2.5 percent from 2.9 percent; and
• Recreation, sport and culture, 0.2 percent from 1.2 percent.
The rest of the commodity groups in the province either remained at their previous month’s rates or had higher inflation rates.
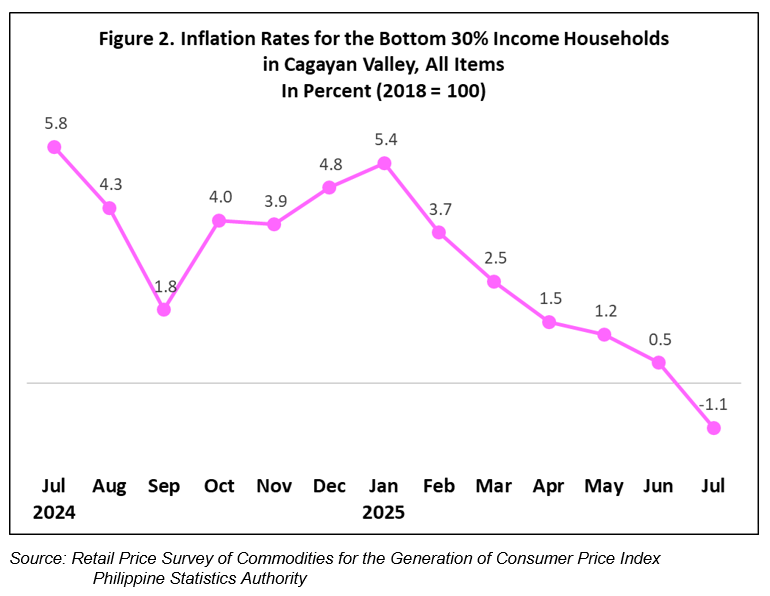
In terms of the region’s inflation rate for the bottom 30% income households, it recorded a negative inflation rate at 1.1 percent in July 2025 from 0.5 percent in June 2025. In July 2024, the inflation rate for this income group was posted at 5.8 percent. (Figure 2)
The negative inflation rate for the bottom 30% income households in July 2025 was primarily brought about by the faster annual decrement in the index of the heavily weighted food and non-alcoholic beverages at -2.5 percent during the month from a -0.6 percent annual decrease in June 2025.
In addition, lower inflation rates were posted by the following commodity groups:
• Housing, water, electricity, gas and other fuels, -4.1 percent from -0.5 percent;
• Restaurants and accommodation services, 5.5 percent from 6.4 percent;
• Transport, -2.4 percent from -1.5 percent;
• Personal care, and miscellaneous goods and services, 2.4 percent from 2.6 percent;
• Clothing and footwear, 1.2 percent from 1.5 percent;
• Education services, 0.6 percent from 1.3 percent;
• Health, 2.0 percent from 2.1 percent; and
• Recreation, sport and culture, 4.1 percent from 4.2 percent.
The indices of the rest of the commodity groups retained their respective previous month’s inflation rates.
_________________________________________________________________________
Note: CPIs and inflation rates by province and selected city are posted at the PSA OpenSTAT Portal at (https://openstat.psa.gov.ph/).
ENGR. GIRME M. BAYUCAN
(Chief Statistical Specialist)
Officer-in-Charge, PSA-RSSO II
//EMDP/JCB/MLLP
| Attachment | Size |
|---|---|
|
|
1.35 MB |
Reference Period
2025