
Release Date :
Reference Number :
2025R0215- SR005
Date of Release: 5 April 2025
Reference No. 2025R0215- SR005
Table A. Year-on-Year Inflation Rates in Cagayan, All Items In Percent (2018=100)
Area | March 2024 | February 2025 | March 2025 | Year to Date* |
Philippines | 3.7 | 2.1 | 1.8 | 2.2 |
Cagayan Valley | 3.5 | 3.9 | 2.9 | 3.9 |
Cagayan | 4.5 | 4.9 | 4.5 | 5.1 |
Source: Retail Price Survey of Commodities for the Generation of Consumer Price Index (CPI), Philippine Statistics Authority
*Year-on-year change of average CPI for February 2025 vs. 2024
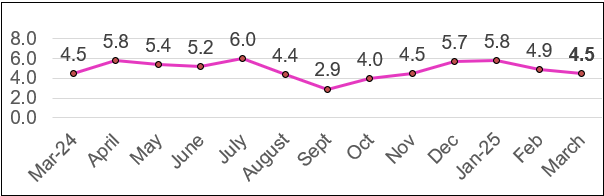
Figure 1. Inflation Rates in Cagayan, All Items, In Percent (2018=100)
Source: Retail Price Survey of Commodities for the Generation of Consumer Price Index (CPI), Philippine Statistics Authority.For more details, visit www.psa.gov.ph
The slower inflation in the province of Cagayan in March 2025 was primarily driven by the decline in the index for alcoholic beverages and tobacco, which dropped to 3.6 percent from 4.8 percent in February 2025. This was followed by a decrease in the index for personal care and miscellaneous goods and services, which slowed to 4.3 percent in March from 5.2 percent in the previous month.
Additionally, the following commodity groups also contributed to the overall deceleration of inflation in March 2025:
a. Clothing and Footwear, which slowed down to 3.6 percent from 4.4 percent
b. Housing, Water, Electricity, Gas, and Other Fuels, down to 6.9 percent from 7.4 percent
c. Furnishings, Household Equipment and Routine Household Maintenance, which eased to 4.0 percent from 4.5 percent
d. Information and Communication, down to 0.5 percent from 0.8 percent
e. Food and Non-Alcoholic Beverages, which slowed slightly to 4.5 percent from 4.7 percent
f. Restaurant and Accommodation Services, down to 9.9 percent from 10.2 percent
Despite the overall slowdown in inflation in the province, the Health index recorded a slight increase, rising to 1.7 percent in March 2025 from 1.4 percent in February 2025.
Meanwhile, the following commodity group indices remained unchanged in March 2025:
Recreation, Sports, and Culture at 2.3 percent
Education Services at 1.7 percent
Financial Services at 0.0 percent
Table B. Year-on-Year Inflation Rates in Cagayan, All Commodity Group, February and March 2025, In Percent (2018=100)
Commodity Group | February 2025 | March 2025 |
4.7 | 4.5 | |
4.8 | 3.6 | |
Clothing and Footwear | 4.4 | 3.6 |
7.4 | 6.9 | |
Furnishing, Household Equipment and Routine Household Maintenance | 4.5 | 4.0 |
Health | 1.4 | 1.7 |
Transport | -0.3 | -1.6 |
Information and Communication | 0.8 | 0.5 |
Recreation, Sport and Culture | 2.3 r | 2.3 |
Education Services | 1.7 | 1.7 |
10.2 | 9.9 | |
Financial Services | 0.0 | 0.0 |
Personal Care and Miscellaneous Goods and Services | 5.2 | 4.3 |
Source: Retail Price Survey of Commodities for the Generation of Consumer Price Index (CPI), Philippine Statistics Authority
r-revised
Food inflation continues to influence the overall inflation trend in the province of Cagayan, registering a slower rate of 4.6 percent in March 2025 compared to 4.9 percent in February 2025. This is also notably lower than the 5.7 percent food inflation recorded in March 2024.
The deceleration in food inflation was primarily driven by the significant slowdown in the year-on-year growth of the index for vegetables, tubers, plantains, cooking bananas, and pulses, which dropped to 15.1 percent in March 2025 from 22.9 percent in February 2025.
In addition, slower annual increases were observed in the following food groups:
a. Fruits nuts, down to 27.2 percent from 28.9 percent
b. Fish and other seafood, down to 8.8 percent from 10.3 percent
c. Flour, bread and other bakery products, pasta products, and other cereals, at 2.6 percent from 3.7 percent
d. Milk, other dairy products, and eggs, at 1.7 percent from 2.4 percent
e. Meat and other parts of slaughtered land animals, at 15.5 percent from 15.9 percent
f. Ready-made food and other food products not elsewhere classified (N.E.C.), down to 5.8 percent from 6.2 percent
Despite the overall slowdown, an uptick was noted in the index for oils and fats, which rose to 7.6 percent in March 2025 from 2.4 percent in the previous month.
On the other hand, deflationary trends were observed in select food groups:
a. Rice with inflation at -10.8 percent, improving from -13.5 percent
b. Corn, which remained steady at -15.8 percent
c. Sugar, confectionery, and desserts, which registered -1.7 percent, up from -3.8 percent
Table C. Year-on-Year Inflation Rates of Selected Food Items in Cagayan, February and March 2025, In Percent (2018=100)
Selected Food | February 2025 | March 2025 |
|---|---|---|
Rice | -13.5 | -10.8 |
Corn | -15.8 | -15.8 |
Flour, bread and other bakery products, pasta products, and other cereals | 3.7 | 2.6 |
Meat and other parts of slaughtered land animals | 15.9 | 15.5 |
Fish and other seafood | 10.3 | 8.8 |
Milk, other dairy products, and eggs | 2.4 | 1.7 |
Oils and fats | 2.4 | 7.6 |
Fruits and nuts | 28.9 | 27.2 |
Vegetables, tubers plantains, cooking bananas and pulses | 22.9 | 15.1 |
Sugar, confectionary, and dessert | -3.8 | -1.7 |
Ready-made food and other food products N.E.C. | 6.2 | 5.8 |
Source: Retail Price Survey of Commodities for the Generation of Consumer Price Index (CPI), Philippine Statistics Authority
Table D. Year-on-Year Inflation Rates in Cagayan, All Items, January 2020 to March 2025, In Percent (2018=100)
Month | Year | |||||
2020 | 2021 | 2022 | 2023 | 2024 | 2025 | |
January | 1.4 | 6.2 | 2.0 | 8.5 | 4.1 | 5.8 |
February | 1.1 | 6.6 | 2.3 | 8.9 | 4.3 | 4.9 |
March | 1.7 | 6.2 | 3.6 | 7.5 | 4.5 | 4.5 |
April | 0.4 | 6.2 | 4.5 | 6.1 | 5.8 |
|
May | 1.3 | 4.6 | 5.2 | 5.8 | 5.4 |
|
June | 1.4 | 5.7 | 5.0 | 5.3 | 5.2 |
|
July | 1.0 | 6.3 | 5.9 | 4.6 | 6.0 |
|
August | 1.9 | 6.7 | 4.4 | 7.3 | 4.4 |
|
September | 2.1 | 5.9 | 5.8 | 7.2 | 2.9 |
|
October | 2.6 | 5.8 | 7.4 | 5.3 | 4.0 |
|
November | 4.7 | 3.7 | 8.5 | 4.1 | 4.5 |
|
December | 5.2 | 2.8 | 9.0 | 3.5 | 5.7 |
|
Average | 2.1 | 5.5 | 5.3 | 6.1 | 4.7 |
|
Source: Retail Price Survey of Commodities for the Generation of Consumer Price Index (CPI), Philippine Statistics Authority
Note:
CPIs and inflation rates by province and selected city are posted at the PSA website (https://www.psa.gov.ph/).
CRISTETA M. RETOMA
[Supervising Statistical Specialist]
Officer-in-Charge
/SESRE/ADB
| Attachment | Size |
|---|---|
|
|
1.63 MB |