
Release Date :
Reference Number :
2025R0215-SR011
2024 LIVESTOCK SITUATION REPORT
Livestock Production increases by 2.74 percent in 2024
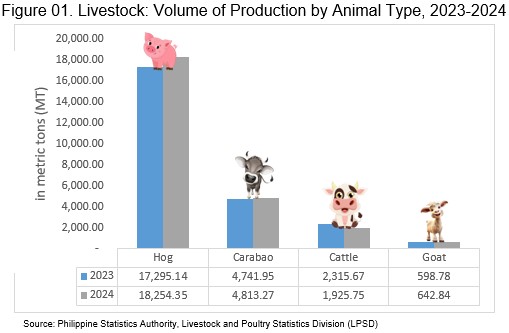
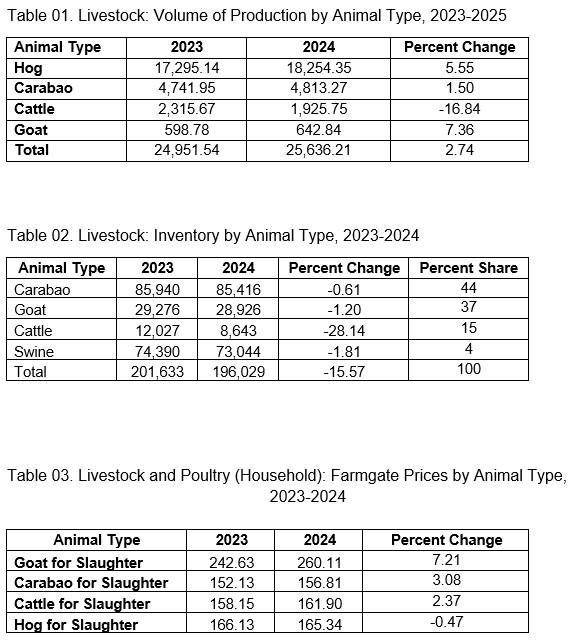
The total volume of livestock production in the Province of Cagayan in 2024 reached 25,636.21 metric tons (MT), reflecting a 2.74 percent increase from the 24,951.54 MT recorded in 2023. (Table 01)
By animal type, hog recorded the highest volume of production at 18,254.35 MT, marking an annual increase of 5.55 percent from 17,295.14 MT in 2023. This was followed by carabao, with a production of 4,813.27 MT, and cattle with 1,925.75 MT, reflecting annual percent changes of 1.50 percent and -16.84 percent, respectively. Meanwhile, goat had the lowest volume of production at 642.84 MT, which represents a 7.36 percent increase from 598.78 MT of previous year. (Figure 01 and Table 01)
Inventory of livestock decreased by -15.57 percent in 2024
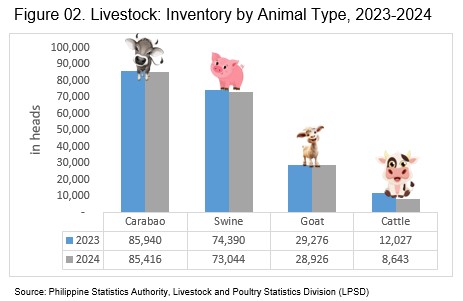
The total livestock inventory in Cagayan declined to 196,029 heads in 2024, representing a -15.57 percent decrease from the 2023 inventory of 201,633 heads. By animal type, carabao inventory accounted at 85,416 heads, marking a -0.61 percent decrease from the 85,940 heads recorded in 2023. Followed by swine with 73,044 heads in 2024, reflecting a -1.81 percent decrease compared to 74,390 heads in 2023. Goat came next, totaling to 28,926 heads, showing a -1.20 percent decrease from the 29,276 heads recorded from the previous year. Meanwhile, cattle remained the least populous, with 8,643 heads, representing a significant decrease of -28.14 percent from the 12,027 heads recorded in 2023 (Figure 02 and Table 02).
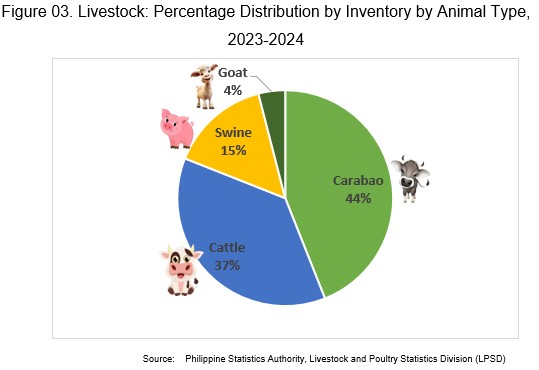
In terms of percentage distribution, carabao accounted for the largest share of the province’s livestock inventory approximately at 44 percent of the total livestock population. This was followed by cattle at 37 percent, swine at 15 percent, and goat at only 4 percent. (Figure 03 and Table 02)
In terms of percentage distribution, carabao accounted for the largest share of the province’s livestock inventory approximately at 44 percent of the total livestock population. This was followed by cattle at 37 percent, swine at 15 percent, and goat at only 4 percent. (Figure 03 and Table 02)

STATISTICAL TABLES
TECHNICAL NOTES
I. Introduction
The Livestock and Poultry Survey: Establishment (LPS:E), formerly known as the Commercial Livestock and Poultry Survey, and the Livestock and Poultry Survey: Household (LPS:H), formerly the Backyard Livestock and Poultry Survey, are among the major agricultural surveys conducted by the Philippine Statistics Authority (PSA). The revised survey titles were implemented starting the first quarter of 2025, following the updated attributes in the System of Designated Statistics approved through PSA Board Resolution No. 16, s.2024, dated 15 November 2024.
These surveys aim to generate estimates on supply, disposition, average farmgate prices, and other related data on livestock and poultry commodities at both the establishment and household levels.
The general purpose of LPS:E and LPS:H is to generate estimates on inventory, number of animals disposed, average farmgate price, egg production of poultry animals, milk production of dairy animals, and other related data.
The Livestock Production Survey: Establishments (LPS:E) is conducted quarterly in all provinces, including the National Capital Region (NCR). Its commodity coverage includes carabao, cattle, swine, goat, sheep, chicken, duck, and other animals raised or tended by the establishments.
Similarly, the Livestock Production Survey: Household (LPS:H) is also conducted in all provinces, including NCR. The commodity coverage for LPS:H includes carabao, cattle, swine, goat, sheep, chicken, duck, horse, rabbit, quail, turkey, goose, and other animals raised or tended by livestock and poultry operators.
Over the years, the PSA gathers the abovementioned information through Pen-and-Paper Personal Interviewing (PAPI) method using a structured questionnaire. To adapt appropriate technology in the generation of relevant and reliable livestock and poultry estimates, and to improve the cycle time in survey operations by eliminating processes such as printing of questionnaires, manual editing, and machine processing of questionnaires, the Livestock and Poultry Statistics Division (LPSD) together with the Systems Development Division and Systems Quality Assurance Division, enhanced the data collection method for Livestock and Poultry Surveys from PAPI to Computer-Assisted Personal Interviewing (CAPI). CAPI is a face-to-face data collection method in which the interviewer uses a tablet or mobile phone to record answers of
the respondent. The CAPI has been implemented as the mode of data collection for LPS:H starting from the first quarter of 2024, and for LPS:E starting from the second quarter of 2024.II. Data Collection
A. LPS:H
1.Reference Date/Period
The schedule of data collection is during the last ten days of the reference quarter. However, data collection for fourth quarter is done one month earlier to comply with the Philippine System of National Accounts calendar.
2. DATA ITEMS GATHERED FROM THE SURVEY
Type of household operation
Inventory by age/type
Breeder that gave birth
Supply Indicator (number of births, hatched live, received/acquired)
Slaughtered/dressed in the household/farm
Sold live for slaughter/dressing
Sold live for other purposes (breeding, fattening)
Average farmgate price
Milk production indicators
Deaths/Losses
Egg production indicators
Average liveweight per head/bird
Disposition by areas of destination
Assessment of household/farm production and farmgate price
Reason/s for the increase/decrease in production and farmgate price
B. LPS:E
1. Reference Date/Period
The reference date for the beginning inventory is the first day of the reference quarter while the ending inventory is the last day of the reference quarter. The reference period for other data items (births, disposition, etc.) is cumulative of the reference months.
2. DATA ITEMS GATHERED IN THE SURVEY
Type of Establishment Operation
Inventory by age/type
Supply indicator (number of births, hatched live, received/acquired)
Slaughtered/dressed in the establishment
Sold live for slaughter/dressing
Sold live for other purposes (breeding, fattening)
Average farmgate price (live animal, eggs)
Milk Production indicators (animals on the milk line, average milk production)
Deaths/Losses
Egg production indicators (laying flock, ELER, conversion rate, etc.)
Average liveweight per head/bird
Disposition by Areas of Destination
Assessment of Establishment’s Production
Reason/s for the increase/decrease in production and farmgate price
III. Concepts and Definitions of Terms
Farmgate price refers to the price received by raisers for their produce at the location of farm. Thus, marketing costs, such as the transport and other marketing costs (if any) incurred in selling the produce, are not included in the farmgate prices.
Inventory refers to the actual number of cattle present in the farm as of a specific reference date.
Volume of production refers to the number of tended/raised cattle disposed for slaughter, including those which were shipped-out for slaughter. This is expressed in metric tons, liveweight.
The data on the Farmgate price, Inventory and Volume of production is based on the definitions indicated above can be accessed in the Openstat website of PSA with the links:
Farmgate price:
https://openstat.psa.gov.ph/PXWeb/pxweb/en/DB/DB__2M__NFG/0032M4AFN10.px/table/tableViewLayout1/?rxid=36898790-9e06-4612-a881-b330956086ac
Inventory:
https://openstat.psa.gov.ph/PXWeb/pxweb/en/DB/DB__2E__LP__INV__NEW/0022E4FINL5.px/?rxid=bdf9d8da-96f1-4100-ae09-18cb3eaeb313
Volume of production:
https://openstat.psa.gov.ph/PXWeb/pxweb/en/DB/DB__2E__LP__PDN/0082E4FPLS2.px/?rxid=bdf9d8da-96f1-4100-ae09-18cb3eaeb313
| Attachment | Size |
|---|---|
|
|
4.45 MB |