Skip to main content
×
Data Request
Email
Password
Address
Address 2
City
State
Choose...
...
Zip
Check me out
Sign in
Philippine Standard Time:
Main navigation
GOVPH
Home
RSSO II
PSA Profile
About Us
Director's Corner
Corporate Values
Organizational Structure
Transparency Seal
PSA Board
Composition
Functions
Resolutions
Board Resolutions
Archived Resolutions
Memorandum
Memo Circulars
Memo Orders
Philippine Statistical System
About PSS
Philippine Statistical Development Program (PSDP)
Statistical Laws
Directory
CRS Outlets
Central Office
Field Office
International Links
Statistics
STATISTICAL FRAMEWORKS & INDICATORS SYSTEM
Core Regional Indicator System
Provincial Product Accounts (PPA)
Regional Accounts
Gross Regional Domestic Expenditure (GRDE)
Gross Regional Domestic Product (GRDP)
Regional Development Indicators
Sustainable Development Goals
Tourism Satellite Accounts
STATISTICAL PLANNING & COORDINATION
National Statistics Month
Philippine Statistics Quiz
Regional Statistical Development Program
Regional Statistics Committee
STATISTICAL OPERATIONS
Agricultural-based Statistics
Corn Production Survey
Crops Production Survey
Fisheries Production Survey
Livestock and Poultry Survey
Rice and Corn Stocks Inventory
Census-based Statistics
Census of Agriculture and Fisheries (CAF)
Census of Population and Housing (CPH)
Censuses of Philippine Business and Industry (CPBI)
Community-based Monitoring System (CBMS)
Updating of List of Aquaculture Farms (ULAF)
Updating of List of Establishments (ULE)
Establishment-based Statistics
Annual Survey of Philippine Business and Industry (ASPBI)
Consumer Price Index (CPI)
MISSI/PPS
OWS/ISLE
Quarterly Survey of Philippine Business and Industry (QSPBI)
Household-based Statistics
Annual Poverty Indicators Survey (APIS)
Family Income and Expenditure Survey (FIES)
Household Energy Consumption Survey (HECS)
Household Survey on Domestic Visitors (HSDV)
Labor Force Survey (LFS)
National Demographic and Health Survey (NDHS)
National Information and Communications Technology Household Survey (NICTHS)
Survey on Children
Survey on Overseas Filipinos
DATABASES
Child Poverty Database
OpenStat
PSADA
Civil Registration
CIVIL REGISTRY DOCUMENTS
Birth Certificate
Marriage Certificate
Death Certificate
CENOMAR
Services for Civil Registry Documents
Application Forms
CHANNELS/PARTNERS
Online Application
PSA Helpline
PSA Serbilis
Directory of Civil Registrars
BREQS
PhilSys
Citizens Charter
Frequently Asked Questions
Online Registration
Registration Centers
Publications
Annual Report
Infographics
PASADA DOS
Press Releases
Quickstat
RSET
Special Releases
Women and Men (WAM)
News and Events
Data Dissemination Forum
Press Conference
Provincial Offices
PSA Batanes
PSA Cagayan
PSA Isabela
PSA Nueva Vizcaya
PSA Quirino
Search
Special Releases
Home
>
Special Releases
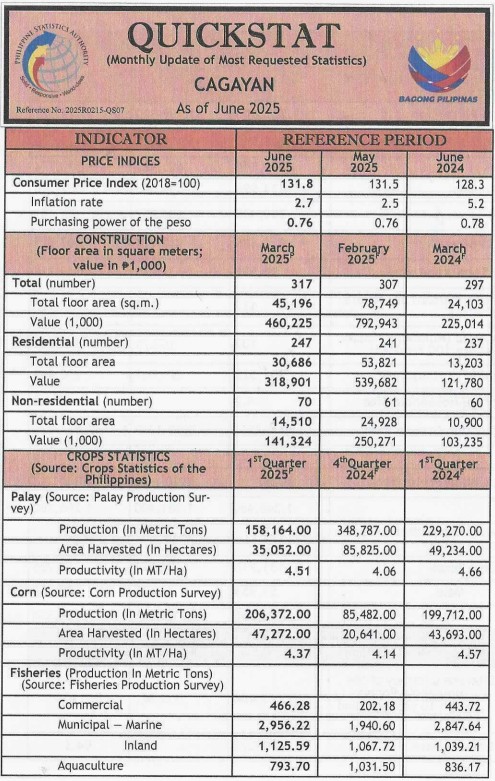
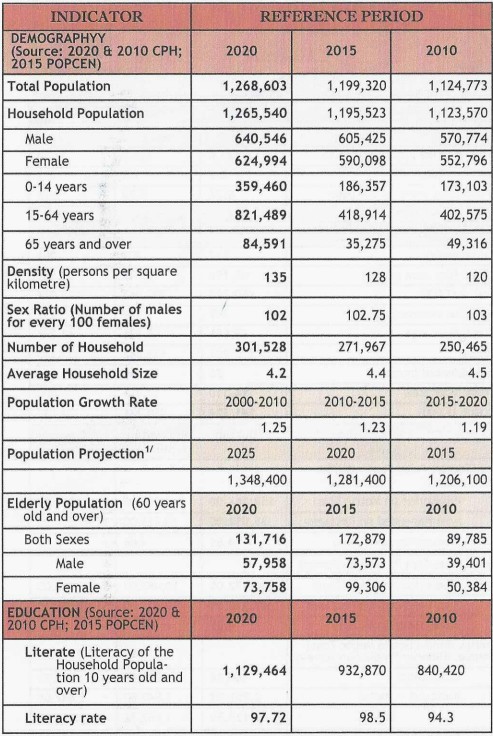
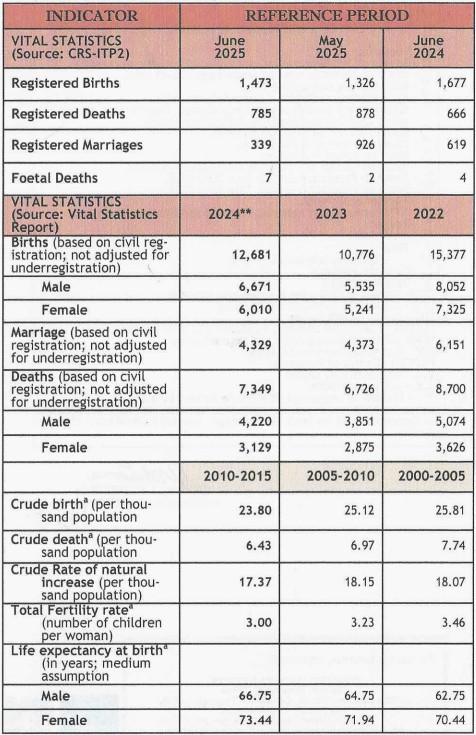
PROVINCE OF CAGAYAN: QUICKSTAT JUNE 2025
Release Date:
Monday, July 21, 2025
Reference Number:
Release Date:
Monday, July 21, 2025
2025RO215-QS07_01.pdf
,
2025RO215-QS07_02.pdf
,
2025RO215-QS07_03.pdf
,
2025RO215-QS07_04.pdf