Release Date :
Reference Number :
2025RO215- SR007
Date of Release: 7 May 2025
Reference No. 2025R0215- SR007
Table A. Year-on-Year Inflation Rates in Cagayan, All Items In Percent (2018=100)
Area | March 2024 | February 2025 | March 2025 | Year to Date* |
Philippines | 3.8 | 1.8 | 1.4 | 2.0 |
Cagayan Valley | 4.2 | 2.9 | 2.0 | 3.4 |
Cagayan | 5.8 | 4.5 | 3.6 | 4.7 |
Source: Retail Price Survey of Commodities for the Generation of Consumer Price Index (CPI), Philippine Statistics Authority
*Year-on-year change of average CPI for February 2025 vs. 2024
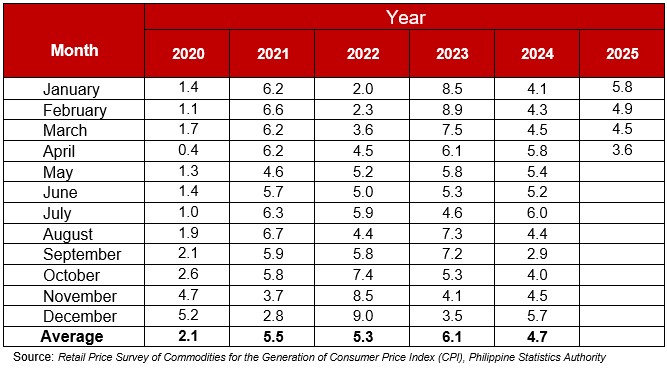
Inflation in the province of Cagayan slowed down to 4.5 percent in March 2025 from 4.9 percent in February 2025. The inflation rate in March 2024 was also recorded at 4.5 percent, indicating a year-on-year stability despite the recent monthly decrease. (Table A, D, and Figure 1).
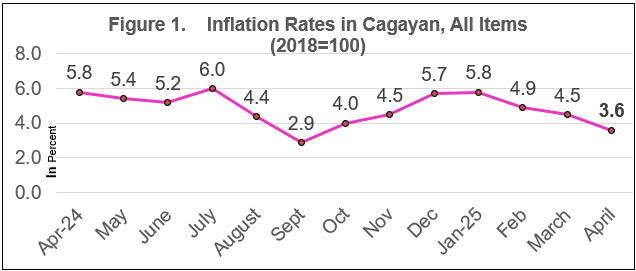
Figure 1. Inflation Rates in Cagayan, All Items, In Percent (2018=100)
Source: Retail Price Survey of Commodities for the Generation of Consumer Price Index (CPI), Philippine Statistics Authority.
For more details, visit www.psa.gov.ph
The slower inflation in the province was brought about by the decrease in the ten commodity groups, with housing, water, electricity, gas, and other fuel being the highest contributors at 4.1 percent in April 2025 from 6.9 percent recorded in March 2025. It was followed by furnishing, household equipment, and routine household maintenance at
2.2 percent in April 2025 from 4.0 percent in March 2025. The following also contributed to the slower inflation for April 2025:a. Recreation, Sports and Culture at 1.3 percent from 2.3 percent
b. Personal Care and Miscellaneous Goods and Services at 3.5 percent from
4.3 percentc. Restaurant and Accommodation Services at 9.2 percent from 9.9 percent
d. Alcoholic Beverages and Tobacco at 3.2 percent from 3.6 percent
e. Clothing and Footwear at 3.3 percent from 3.6 percent
f. Food and Non-alcoholic beverages at 4.4 percent from 4.5 percent
g. Health at 1.6 percent from 1.7 percent
Health at 1.6 percent from 1.7 percent Health at 1.6 percent from 1.7 percent Health at 1.6 percent from 1.7 percentInformation and communication is the only commodity group that showed an increased inflation of 0.6 percent in April 2025, as compared to 0.5 percent recorded in March 2025.
On the other hand, transport retained its negative inflation at -2.8 percent in April 2025 from -1.6 percent in March 2025.
Meanwhile, the following group indices remained constant for April 2025:
a. Education Services at 1.7 percent
d. Financial Services at 0.0 percent
Table B. Year-on-Year Inflation Rates in Cagayan, All Commodity Group, March and April 2025, In Percent (2018=100)
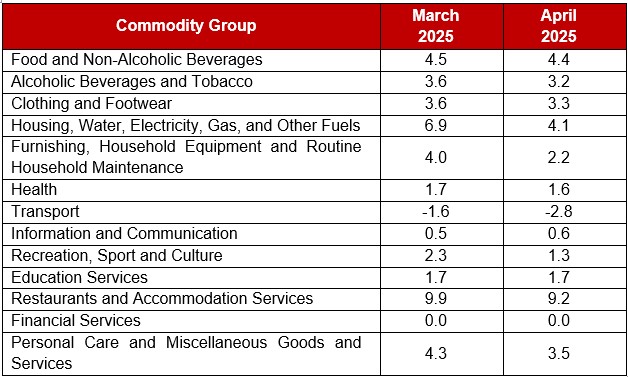
Source: Retail Price Survey of Commodities for the Generation of Consumer Price Index (CPI), Philippine Statistics Authority
r-revised
The overall food inflation in the province remained at 4.6 percent in April 2025 same as recorded in March of the same year.
The constant food inflation observed for the month in review was the result yielded by the combination of slower, faster, and no movement year-on-year annual growth rate as follows:
Slower:
a. Vegetables, tubers, plantains, cooking bananas, and pulses at 10.8 percent from 15.1 percent
b. Flour, bread, and other bakery products, pasta products, and other cereals at
1.2 percent from 2.6 percentc. Ready-made food and other food products N.E.C. at 5.2 percent from 5.8 percent
Faster:
a. Fruits and nuts at 31.0 percent from 27.2 percent
b. Fish and other seafoods at 11.3 percent from 8.8 percent
c. Oils and fats at 9.5 percent from 7.6 percent
d. Meat and other parts of slaughtered animals at 17.1 percent from 15.5 percent
Milk, other dairy products, and eggs maintained their 1.7 percent inflation in April 2025 compared to March 2025.
On the other hand, negative inflation was observed in the following food groups:
a. Rice at -12.8 percent from -10.8 percent
b. Corn at -13.0 percent from -15.8 percent
Corn at -13.0 percent from -15.8 percentc. Sugar, confectionery and dessert at -2.6 percent from -1.7 percent
Table C. Year-on-Year Inflation Rates of Selected Food Items in Cagayan, March and April 2025 in Percent (2018=100)
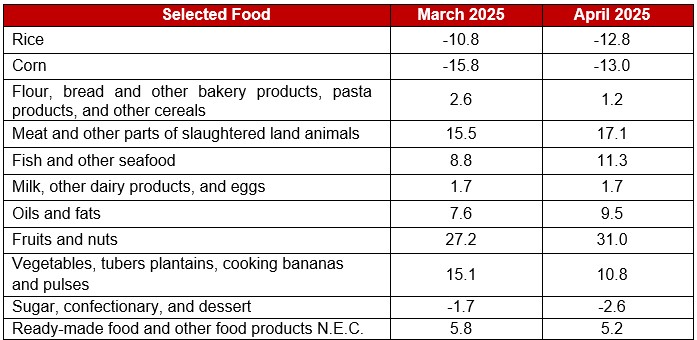
Source: Retail Price Survey of Commodities for the Generation of Consumer Price Index (CPI), Philippine Statistics Authority
Table D. Year-on-Year Inflation Rates in Cagayan, All Items January 2020 to April 2025 In Percent (2018=100)
| Attachment | Size |
|---|---|
|
|
1.37 MB |