
Release Date :
Reference Number :
2025R0215-SR010
Other Crops in Cagayan Declined by 13.69%
in the Second Semester of 2024: A Situation Report
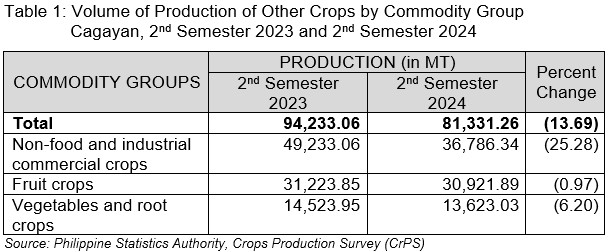
The production of Other Crops in Cagayan declined by -13.69 percent in the second semester of 2024, lower than the growth recorded during the same period in 2023. The province's total volume of production reached 81,331.26 MT, a decrease of 12,901.8 MT from its 2023 level.
The overall decrease was primarily driven by a -25.28 percent drop in Non-Food Industrial Crops, coupled with decrease of -0.97 percent in Fruit Crops, and -6.20 percent in Vegetables and Root Crops, on the same reference period (Table 1).
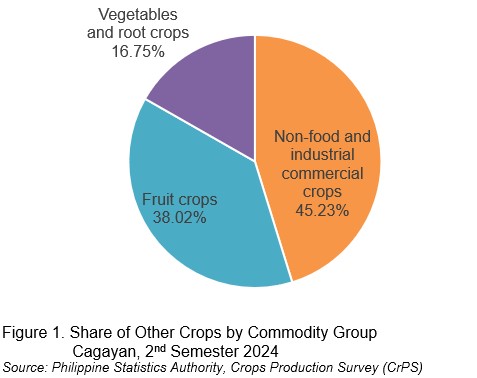
Of the 81,331.26 MT total Other Crops production in Cagayan in the second semester of 2024, about 45.23 percent were produced by Non-food and industrial commercial crops. This is followed by Fruit crops which accounted 38.02 percent of the total production. Meanwhile, Vegetables and root crops accounted for the least share with 16.75 percent. (Figure 1)
TOP FIVE MAJOR OTHER CROPS IN CAGAYAN
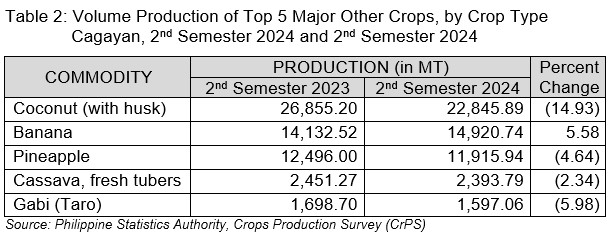
Among the province’s top five major Other Crops, Coconut (with husk) recorded the highest production in the second semester of 2024, reaching 22,845.89 MT a decrease of -14.93 percent from the previous year. Banana followed with 14,920.74 MT but registered a 5.58 percent increase compared to the same period in 2023.
Pineapple and Cassava (fresh tubers) production reached 11,915.94 MT and 2,393.79 MT, exhibiting a downward trend rate of -4.64 percent and -2.34 percent, respectively. Meanwhile, Gabi (taro), which ranked fifth, recorded 1,597.06 MT, reflecting a -5.98 percent decrease from the previous year’s production. (Table 2)
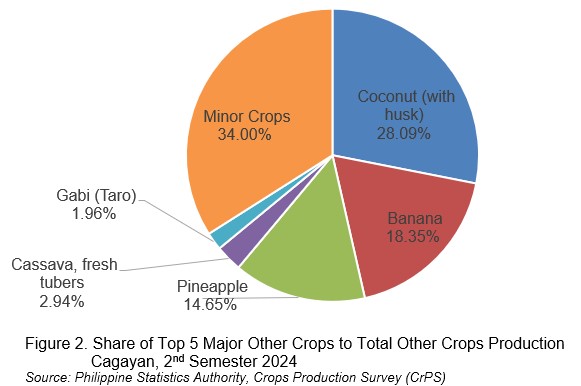
Among the province’s top five major Other Crops, Coconut (with husk) had the largest share, accounting for 28.09 percent of Cagayan's total other crops production in the second semester of 2024. This was followed by Banana at 18.35 percent, Pineapple at 14.65 percent, Cassava, fresh tubers at 2.94 percent, and Gabi (Taro) at 1.96 percent. Meanwhile, Minor Crops collectively accounted for 34 percent of the total other crops production in the province during the same period. (Figure 2)
VOLUME OF PRODUCTION BY SUB-COMMODITY GROUP
A. Non-food and industrial commercial crops (NFICCs)
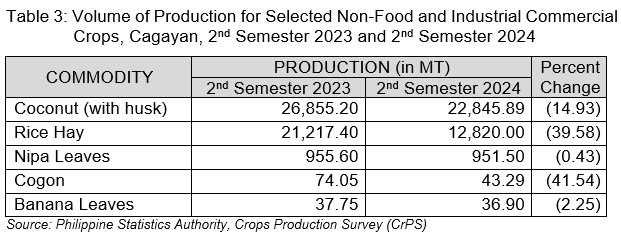
Among the province’s selected NFICCs, Coconut (with husk) recorded the highest production in the second semester of 2024, reaching 22,845.89 MT—a decrease of -14.93 percent from the previous year. Rice Hay followed with 12,820.00 MT, reflecting a -39.58 percent decline compared to the same period in 2023.
Nipa Leaves production reached 951.50 MT, showing a -0.43 percent decrease. Cogon production reached 43.29 MT, marking a double-digit decline of -41.54 percent from the previous. Meanwhile, Banana Leaves, which ranked fifth, recorded 36.90 MT, reflecting a -2.25 percent decrease from the previous year. (Table 3)
B. Fruit crops
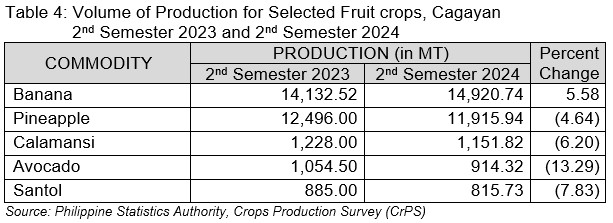
Among selected Fruit crops, Pineapple, Calamansi, Avocado and Santol recorded a decline in production during the period under review. Avocado production reached 914.32 MT, reflecting a -13.29 percent decrease from the previous year. Santol production fell by -7.83 percent to 815.73 MT, while Calamansi production dropped by -6.20 percent to 1,151.82 MT. Pineapple production also declined by -4.64 percent, reaching 11,915.94 MT.
On the other hand, Banana production increased by 5.58 percent, reaching 14,920.74 MT compared to the previous year's output. (Table 4)
C. Vegetables and root crops
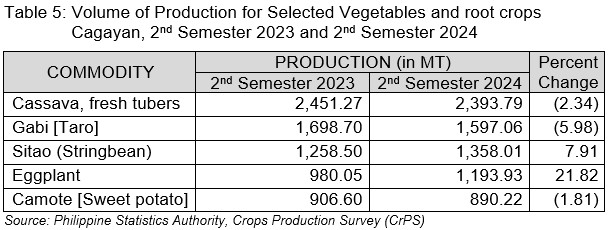
Among selected Vegetables and root crops, Cassava (fresh tubers) production dropped to 2,393.79 MT, reflecting a -2.34 percent decrease from the previous year. Gabi (Taro) production fell by -5.98 percent to 1,597.06 MT, while Sitao (Stringbeans) and Eggplant registered an increase of 7.91 percent and 21.82 percent, reaching 1,358.01 MT and 1,193.93 MT, respectively. Meanwhile, Camote (Sweet potato) production declined by 1.81 percent, totaling 890.22 MT. (Table 5)
Technical Notes:
The Crops Production Survey (CrPS) is one of the major agricultural surveys conducted by the Philippine Statistics Authority (PSA). This survey aims to generate estimates on volume of production, area planted/harvested, number of bearing trees/hills/vines, and farmgate prices for crops other than palay and corn at the national and sub-national levels.
The general purpose of the CrPS is to generate estimates on the volume of production, area planted/harvested, number of bearing trees/hills/vines, and farmgate prices for crops other than palay and corn at the national and sub-national levels.
The CrPS is conducted in all provinces, excluding the National Capital Region, based on its Philippine Standard Geographic Code (PSGC) classification. The commodity coverage varies by province based on the availability in terms of planting and seasonality.
The reference period for production, area planted/harvested, number bearing trees/hills/vines, are quarterly, last 10 days of the month for farmgate prices and while for the information on standing crops and expected area planted/harvested and bearing trees/hills/vines is for the succeeding months/quarters.
Data Items Gathered in the Survey
• Geographic Identification
• Sample Identification
• Status of Operation of the Household
• Information on Crops Production (crops harvested, unit of measure used in harvesting
the crop, quantity harvested, equivalent weight in kilogram per unit of measure)
• Information on Area Planted/Harvested
• Information on Total Number of Bearing Trees/Hills/Vines
• Information on Actual Number of Bearing Trees/Hills/Vines Harvested
• Assessment of Households Production
• Reason for Higher/Lower Production
• Information on Standing Crop (trees/hills/vines that previously borne fruits and are
expected to bear fruits for permanent crops and expected area to be harvested in the
next three months for temporary crops).
• Information on Farmgate Prices (crops sold, trading date, trading location,
unit of measure used in selling the crop, equivalent weight in kilogram per unit
of measure, price per unit of measure, quantity sold in unit of measure,
total sales of the crop, total marketing cost, transport cost, and other marketing cost)
• Assessment of Households Farmgate Price
• Reason/s for Higher/Lower Farmgate Price

| Attachment | Size |
|---|---|
|
|
869.24 KB |