
Release Date :
Reference Number :
SR2025-015
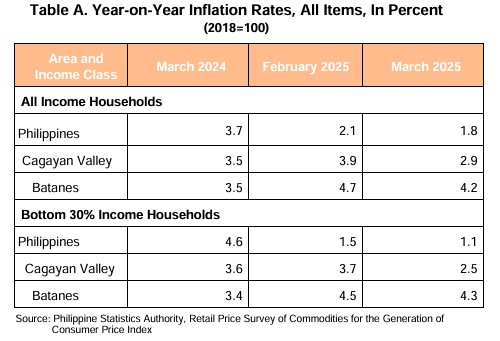
The inflation rate for all income households in the province of Batanes decelerated in March 2025 at 4.2 percent from 4.7 percent in February 2025. Compared to the same period last year, the March 2024 inflation rate was lower by 0.7 percentage points, recorded at 3.5 percent (refer to Table A and Figure 1). At the regional level, inflation in Cagayan Valley also experienced deceleration from 3.9 percent in February 2025 to 2.9 percent in March 2025. Nationally, the inflation rate followed a similar trend, dropping to 1.8 percent in March 2025 from 2.1 percent the previous month (see Table A).
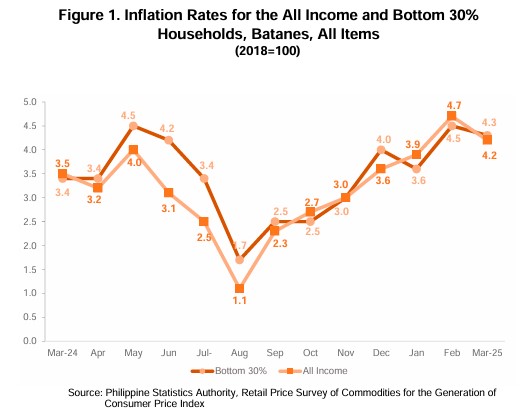
For the bottom 30 percent income households, or the household whose per capita income falls below the bottom 30 percent of the cumulative per capita distribution, inflation decelerated to 4.3 percent in March 2025. Meanwhile, the regional and national year-on-year change in price index for the low-income group decelerated from its previous month’s annual rates at 2.5 percent and 1.1 percent, respectively (Table A). Figure 1 shows that the inflation for the bottom 30 percent income household in the province is generally higher than the inflation for all income household. During the reference month, inflation for the low-income group recorded a higher rate (4.3%) than that of all income households (4.2%). This means that the commonly purchased goods and services of the low-income group increased at a faster pace than the commodities in the market basket for all income households.
The major driver of downward trend in the province’s inflation for all income households was the lower year-on-year change in the index of transport which dropped from 9.0 percent in February 2025 to 2.8 percent in March 2025. This was followed by the decrease in the growth of restaurants and accommodation services which decelerated from 15.5 percent to 12.7 percent, and alcoholic beverages and tobacco which decreased from 9.8 percent in the previous month to 9.3 percent during the reference period. Other commodity which contributed to the downtrend of this month’s inflation is health which slowed from 1.0 percent in February 2025 to 0.9 percent in March 2025.
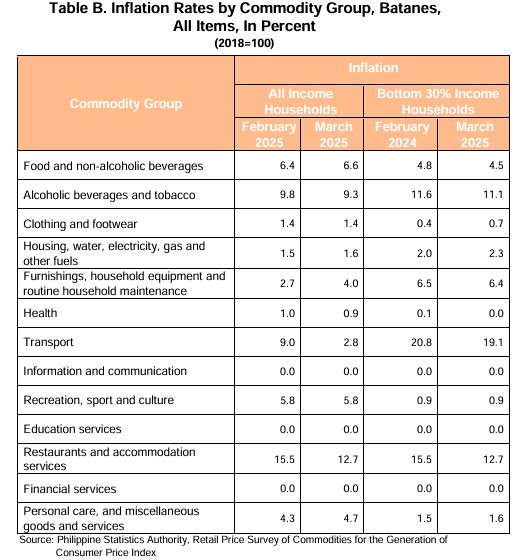
In contrast, food and non-alcoholic beverages (6.6%); housing, water, electricity, gas and other fuels (1.6%); furnishings, household equipment and routine household maintenance (4.0%); and personal care, and miscellaneous goods and services (4.7%) exhibited a faster growth on the year-on-year change in their indices during the reference period. In addition, clothing and footwear, and recreation, sport and culture maintained their previous month’s inflation at 1.4 percent, and 5.8 percent, respectively. Meanwhile, education services, information and communication, and financial services posted a zero percent annual rate. (Table B)
For the bottom 30 percent income households, the deceleration of inflation was due to the decreased in food and non-alcoholic beverages (4.5%); transport (19.1%); alcoholic beverages and tobacco (11.1%); restaurants and accommodation services (12.7%); furnishings, household equipment and routine household maintenance (6.4%); and health (0.0%). (Table B)
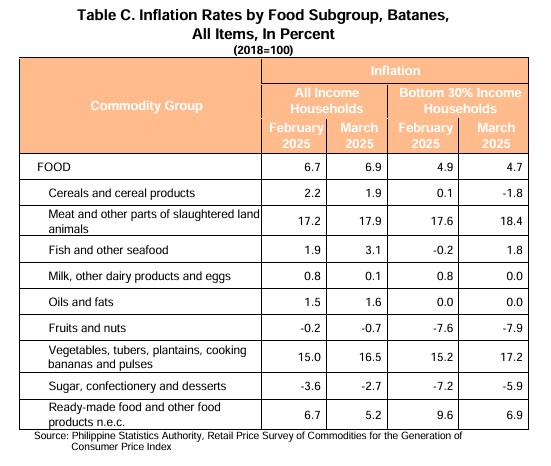
Inflation for food for all income households accelerated to 6.9 percent during the reference month from 6.7 percent in the previous month. Meanwhile, food inflation for the low-income group decelerated in March 2025 to 4.7 percent from 4.9 percent in February 2025. (Table C)
The main drivers of the higher inflation for food for all income households are the increased in the annual growth of indices in the food groups: vegetables, tubers, plantains, cooking bananas and pulses (16.5%); fish and other seafood (3.1%); and meat and other parts of slaughtered land animals (17.9%).
For the bottom 30 percent households, the main drivers were the lower inflation of cereals and cereal products (-1.8%); ready-made food and other food products (6.9%); and milk, other dairy products and eggs (0.0%).
Note:
CPIs and inflation rates by province and selected city are posted at the PSA website (https://www.psa.gov.ph/).
RAMIL G. ABAD
Chief Statistical Specialist
PSA-Batanes
| Attachment | Size |
|---|---|
|
|
198.95 KB |
Reference Period
2025