
Release Date :
Reference Number :
2025-CPI-SR-014

Inflation is the rate of at which the general level of prices for goods and services is rising, and subsequently, purchasing power is falling. It is typically measured as an annual percentage increase. It reflects how much more expensive it has become to purchase the same set of goods and services.
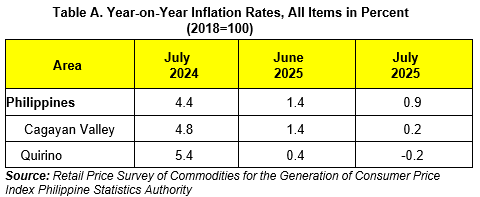
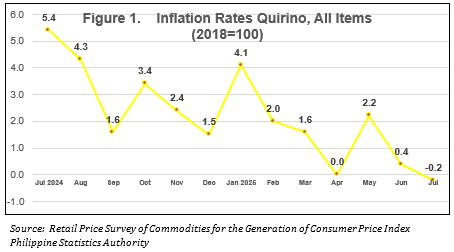
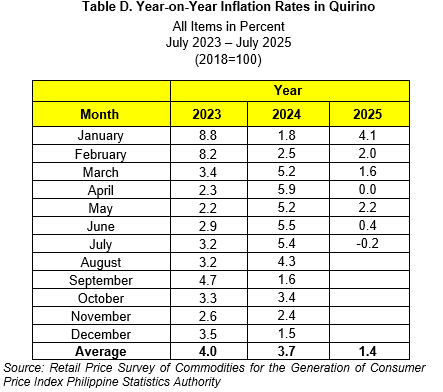
Inflation rate in the province of Quirino decelerated at -0.2 percent in July 2025 from 0.4 percent in June 2025. Inflation in July 2024 was higher at 5.4 percent compared with the -0.2 percent in July 2025.
Also, inflation in Quirino is lower by -0.4 percent with Cagayan Valley’s inflation at 0.2 percent. Quirino also posted a lower inflation rate by -1.1 percent compared with the entire country’s inflation at 0.9 percent. (Table A)
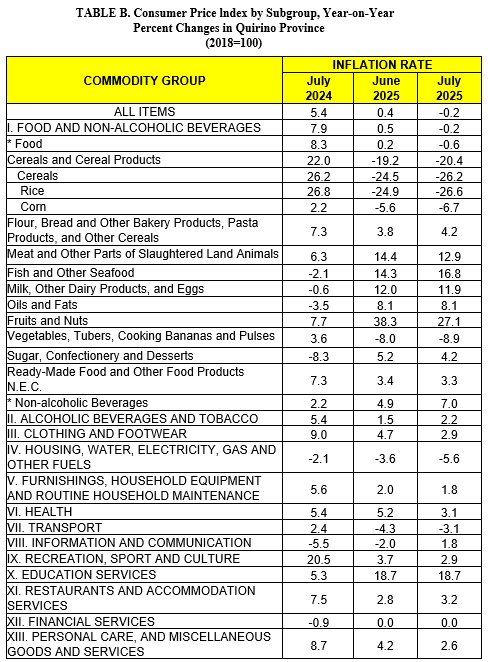
The overall inflation rate in the province of Quirino was mainly brought about by the annual decreased in the index for Food and Non-alcoholic Beverages at -0.2 percent, Housing, Water, Electricity, Gas and Other Fuels at -5.6 percent, and Personal Care, and Miscellaneous Goods and Services, at 2.6 percent.
In addition, contributing to the downtrend in the overall inflation rate of the province during the month were:
Clothing and Footwear at 2.9 percent;
Health, at 3.1 percent;
Furnishings, Household Equipment and Routine Household Maintenance, at 1.8 percent; and
Recreation, Sport and Culture, at 2.9 percent
On the other hand, four (4) commodity groups exhibited an uptrend in the year-on-year growth of their indices which include the following:
Alcoholic Beverages and Tobacco, at 2.2 percent;
Transport, at -3.1 percent;
Information and Communication, at 1.8 percent; and
Restaurant and Accommodation Services at 3.2 percent
The rest of the commodity groups either retained their previous month’s inflation rates or had zero percent annual growths. (Table B)
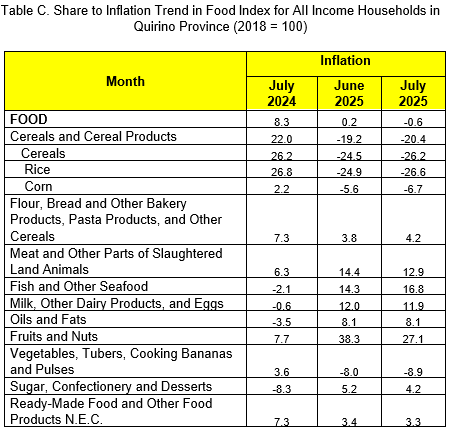
For food index, it decreased further by -0.2 percent in July 2025, from 0.5 percent in the previous month. In July 2024, food index was higher at 7.9 percent compared with -0.2 percent in July 2025. (Table B)
The following food groups exhibited lower rate during the month:
Meat and Other, at 12.9 percent;
Milk, other dairy products and eggs, at 11.9 percent;
Fruits and Nuts, at 27.1 percent;
d. Sugar, Confectionery and Desserts, at 4.2 percent; and
e. Ready-Made Food and Other Food Products N.E.C., 3.3 percent
The following food groups exhibited higher rate during the month:
Flour, Bread and Other Bakery Products, Pasta Products, and Other Cereals, at 4.2 percent;
Fish and Other Seafood, at 16.8 percent;
The following food groups exhibited negative rate during the month:
Cereals, at -26.2 percent;
Rice, at -26.6 percent;
Corn, at -6.7 percent; and
Vegetables, tubers, plantain, etc., at -8.9 percent
DEFINITIONS AND CONCEPTS
Price
Is the amount or value paid in exchange for the commodity, or a service rendered.
Retail Consumer Price
refers to the price at which a commodity is sold in small quantities for consumption.
Market Basket
a term used to refer to a sample of goods and services that are commonly purchased and bought by an average Filipino household.
Consumer Price lndex (CPl)
it is an indicator of the change in the average retail prices of a fixed basket of goods and services commonly purchased by an average Filipino household. lt shows how much on the average, prices of goods and services have increased or decreased from a particular reference period known as base year.
lnflation Rate
is an indicator derived from the CPl. lt refers to the annual rate of change or the year-on-year change of the CPI expressed in percent. lnflation is interpreted in terms of declining purchasing power of money.
Weight
a value attached to a commodity or group of commodities depending on the magnitude of its contribution to the index.
Base Period
a reference date at which the index is equal to 100. Base year is 2018.
lndex Methodology
a Laspeyre's formula: fixed base year and weights.
Purchasing Power of the Peso (PPP)
the measure of how much the peso in the base period is worth in the current period.
Percentage Change
Is a simple mathematical concept that represents the degree of change over time. lt is used for many purposes in finance, often to represent the price change of a security.
Headline lnflation
measures change in the cost of living based on movements in the prices of a specified basket of major commodities. lt refers to the annual rate of change or the year-on-year change in the Consumer Price lndex (CPl).
ENGR. CHERRY GRACE D. AGUSTIN
Chief Statistical Specialist
| Attachment | Size |
|---|---|
|
|
550.91 KB |
Reference Period
2025